December 7th, 2021
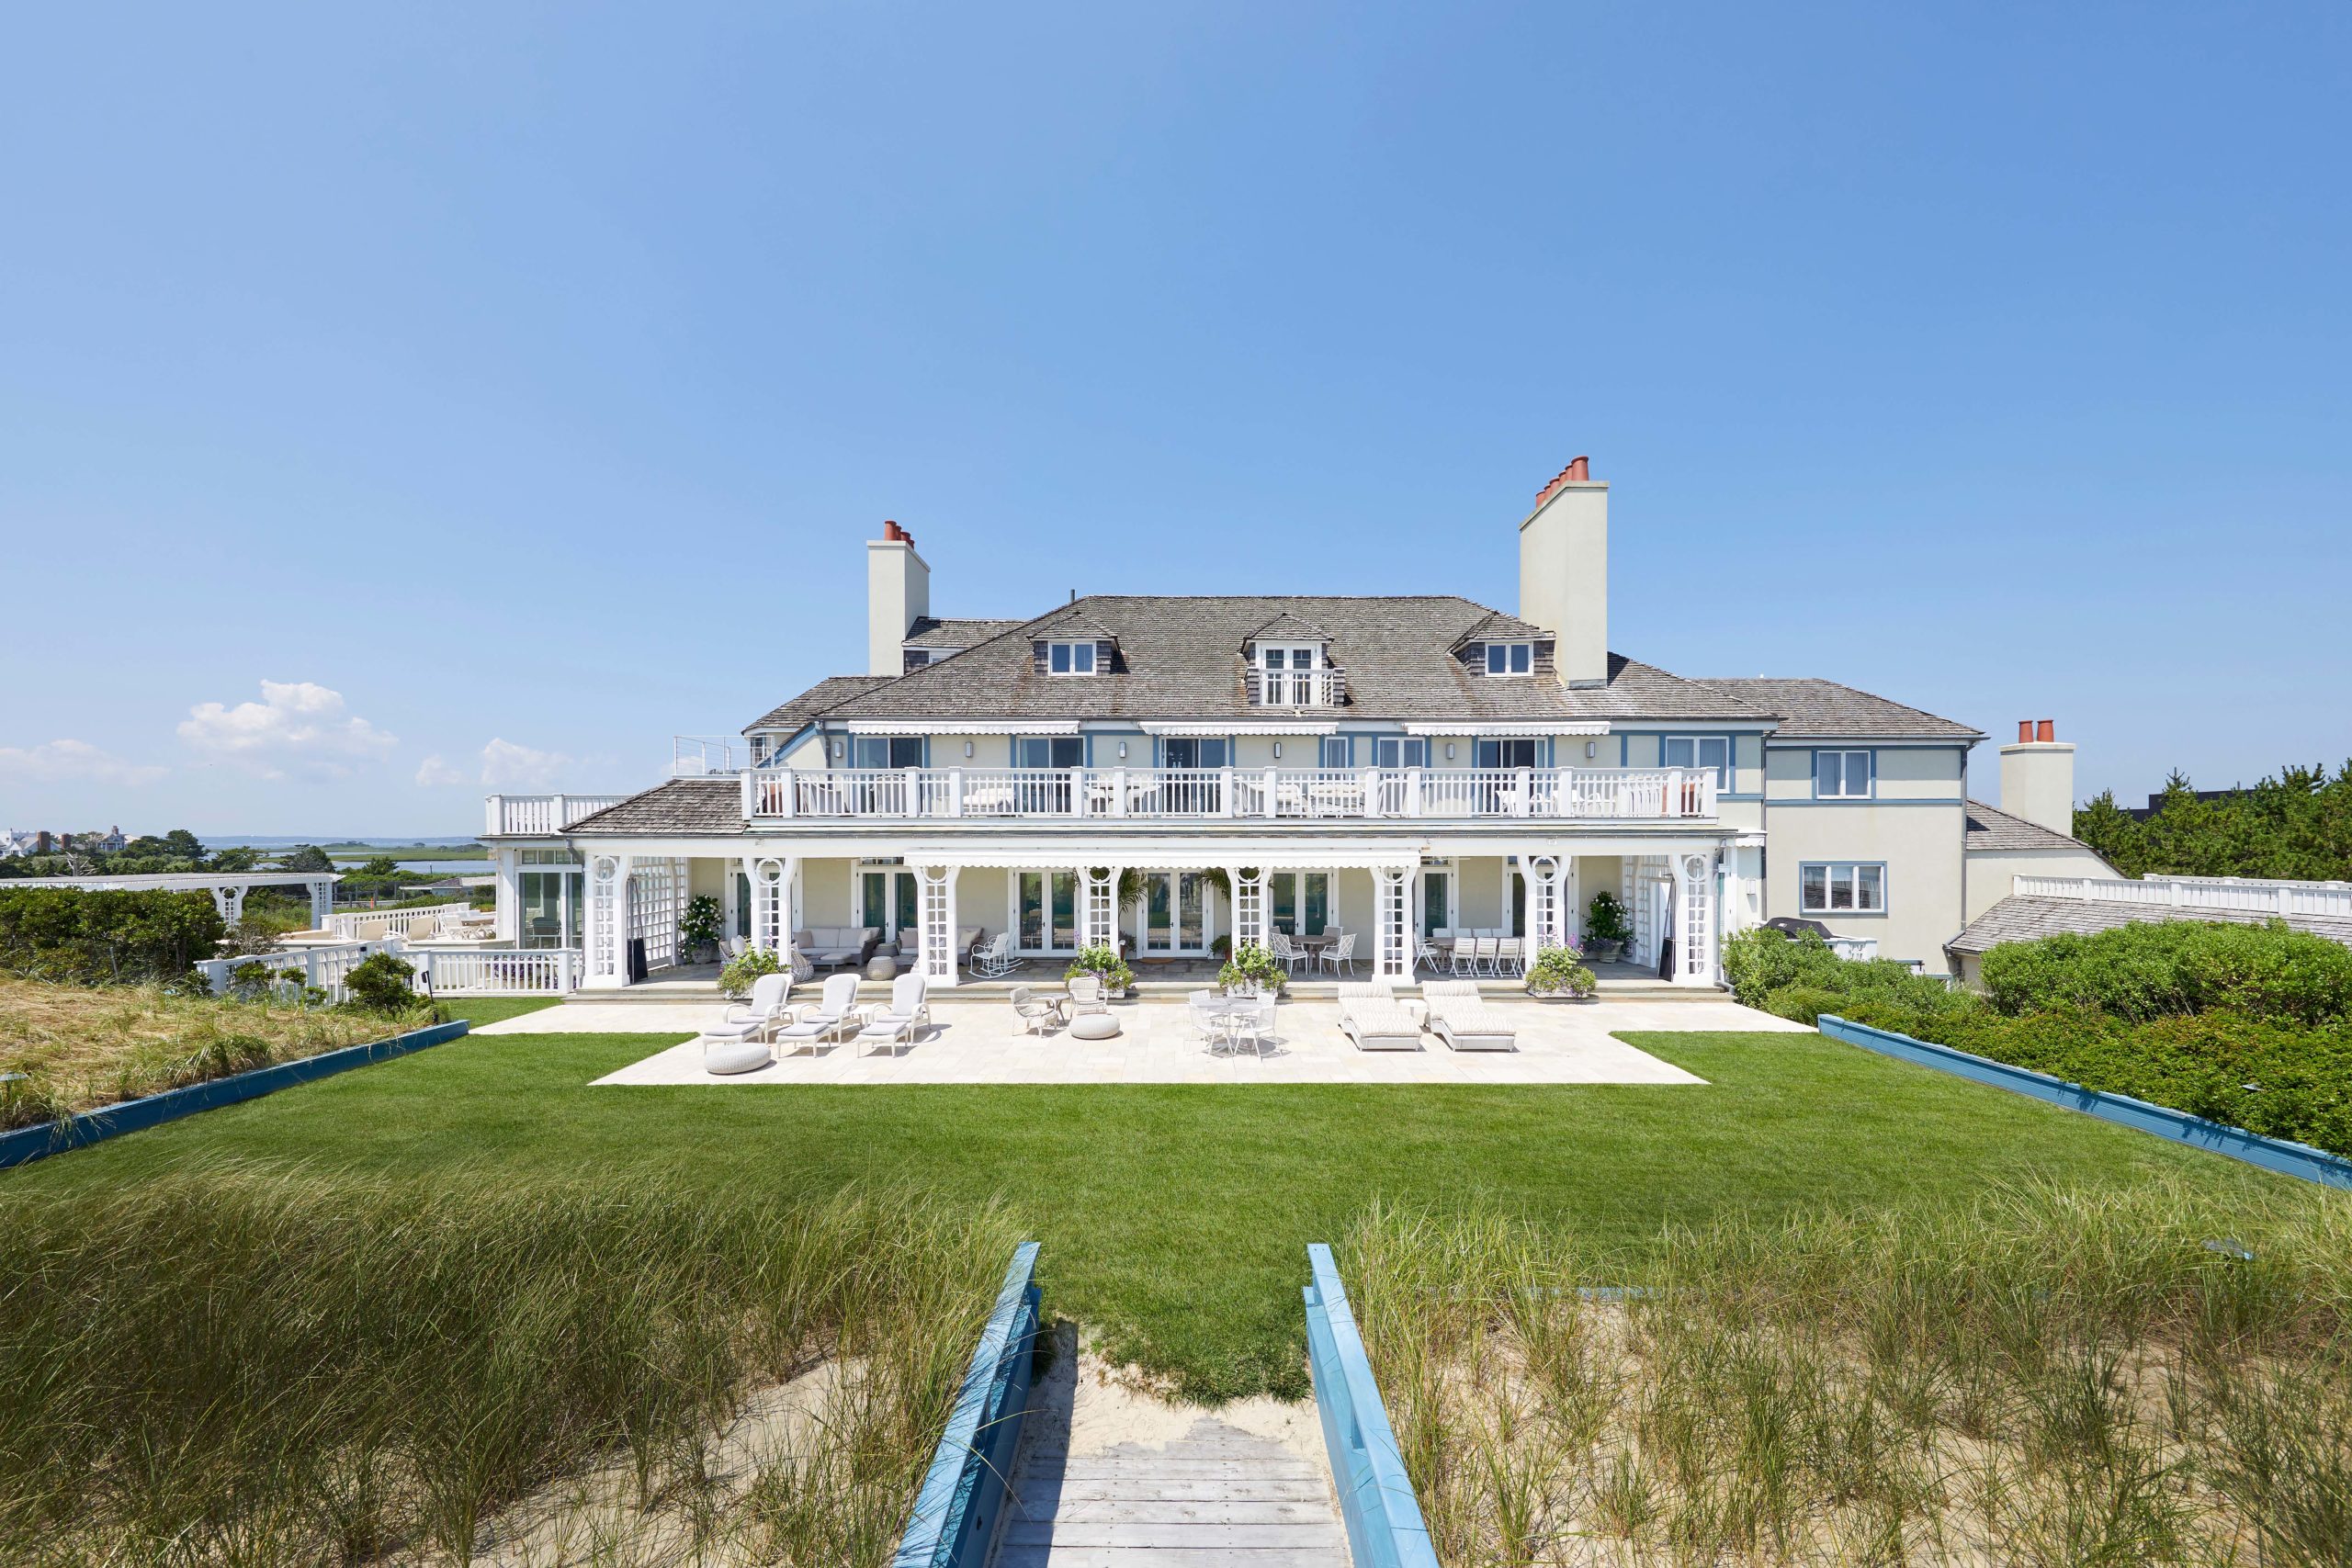
Mylestone at Meadow Lane, Southampton, NY.
Unrivaled Historic, Double Waterfront Estate | 8 Acres+/- | 15,521 SF+/- 11 Beds | 12F/4H Baths
Bespoke Exclusive. LP – $175,000,000 BespokeRealEstate.com
Coming off of a record-breaking 2020, this year has surpassed sales quantities and volumes, with $10 billion in total sales volume, 537 sales and an average asking price of $18,242,211 across the Hamptons, New York City and South Florida ultra-luxury markets. Here’s a breakdown of what we have seen this year and what we expect to come.
For a more in-depth analysis of the $10 Million+ Market, contact businessdevelopment@bespokerealestate.com.
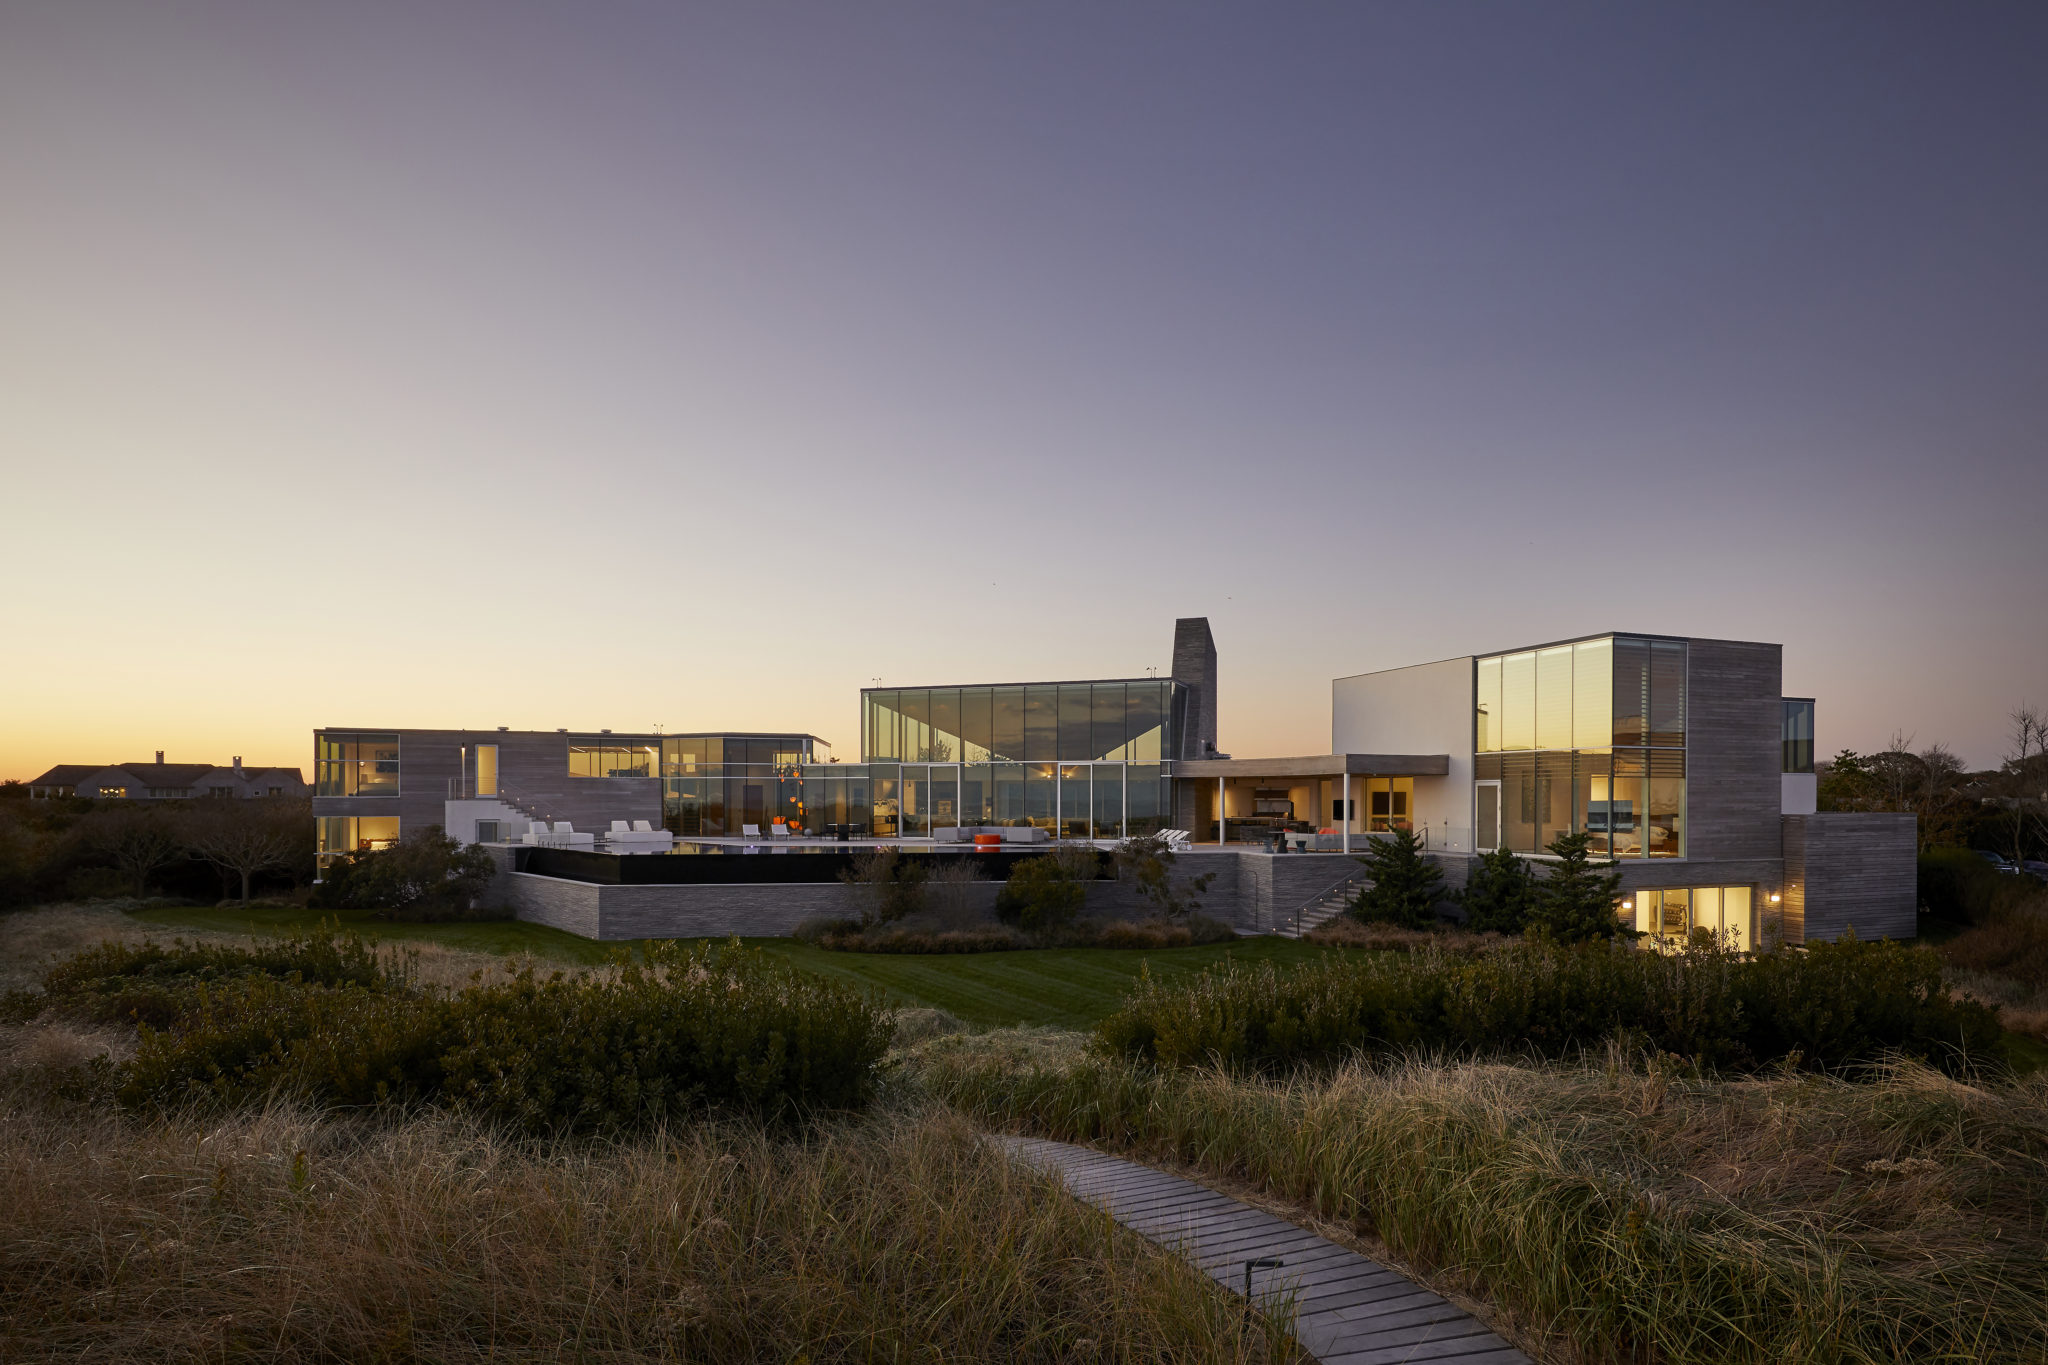
115 Beach Lane, Wainscott, NY. Oceanfront
2.55 Acres+/- 11,000 SF+/- | 6 Beds | 10F/1H Baths.
Sold by BespokeRealEstate.com Q4 2021 LP – $52,000,000
HAMPTONS MARKET REPORT
In last year’s issue, we reported record- breaking sales, and for the time, they were. Yet so far, the Hamptons has had 87 $10 million+ transactions in the first three quarters of 2021, only six less than the number of sales in the entire year of 2020. As markets stabilize this year, this sales rate indicates a healthily growing Hamptons market as we head into the fourth quarter and 2022. In turn, the Hamptons market has met the 2020 sales volume total in the first three quarters, at $1.6 billion in sales volume year to date.
The second quarter stood out this year the most, carrying 55 percent of the year’s sales volume and 48 percent of the number of sales, marked by a 100 percent increase in number of sales between Q1 to Q2. While market activity in the third quarter slowed down a bit, Q3 2021 nonetheless had 20 percent more transactions than Q3 2020, at 24 trades.
$1.6B total $10M+ sales volume 2021 YTD $17.1M average sales price
87 Total $10M+ sales 2021 YTD
2020 Comparison
93 total sales
$1.6B sales volume
$17.4M average sales price
121 Nurmi Drive, Fort Lauderdale. Waterfront
.275 Acre+/- 6,447 SF+/- | 3 Beds | 4F/2H Baths
Bespoke Exclusive. $10,000,000 BespokeRealEstate.com
Courtesy Cadence, Landscape Architects
SOUTH FLORIDA MARKET REPORT
With the rapid migration from the northeast, the massive gains in the $10 million+ South Florida market indicates that it is not slowing down despite the renewed interest this year in northeast markets like the Hamptons and New York City. With 279 $10 million+ transactions and $5.4 billion total sales volume, South Florida retains the most market activity of the three analyzed, though trends in South Florida mirror those of the Hamptons and New York City.
Like the Hamptons, Q2 stood out as the most successful quarter, making up 50 percent of the total number of trades this year. Despite a third quarter dip, the third quarter still outperformed Q3 2020, with a 25 percent increase in quantity and 47 percent increase in sales volume, carried by the increase in sales in the $20-$30 million price range. South Florida sales were split between Palm Beach and Miami-Dade counties, at 116 and 163 trades.
$5.4B total $10M+ sales volume 2021 YTD | $19.2M average sales price
279 total $10M+ sales 2021 YTD | 2020 comparison197 total sales$3.5B sales volume$17.6M average sales price
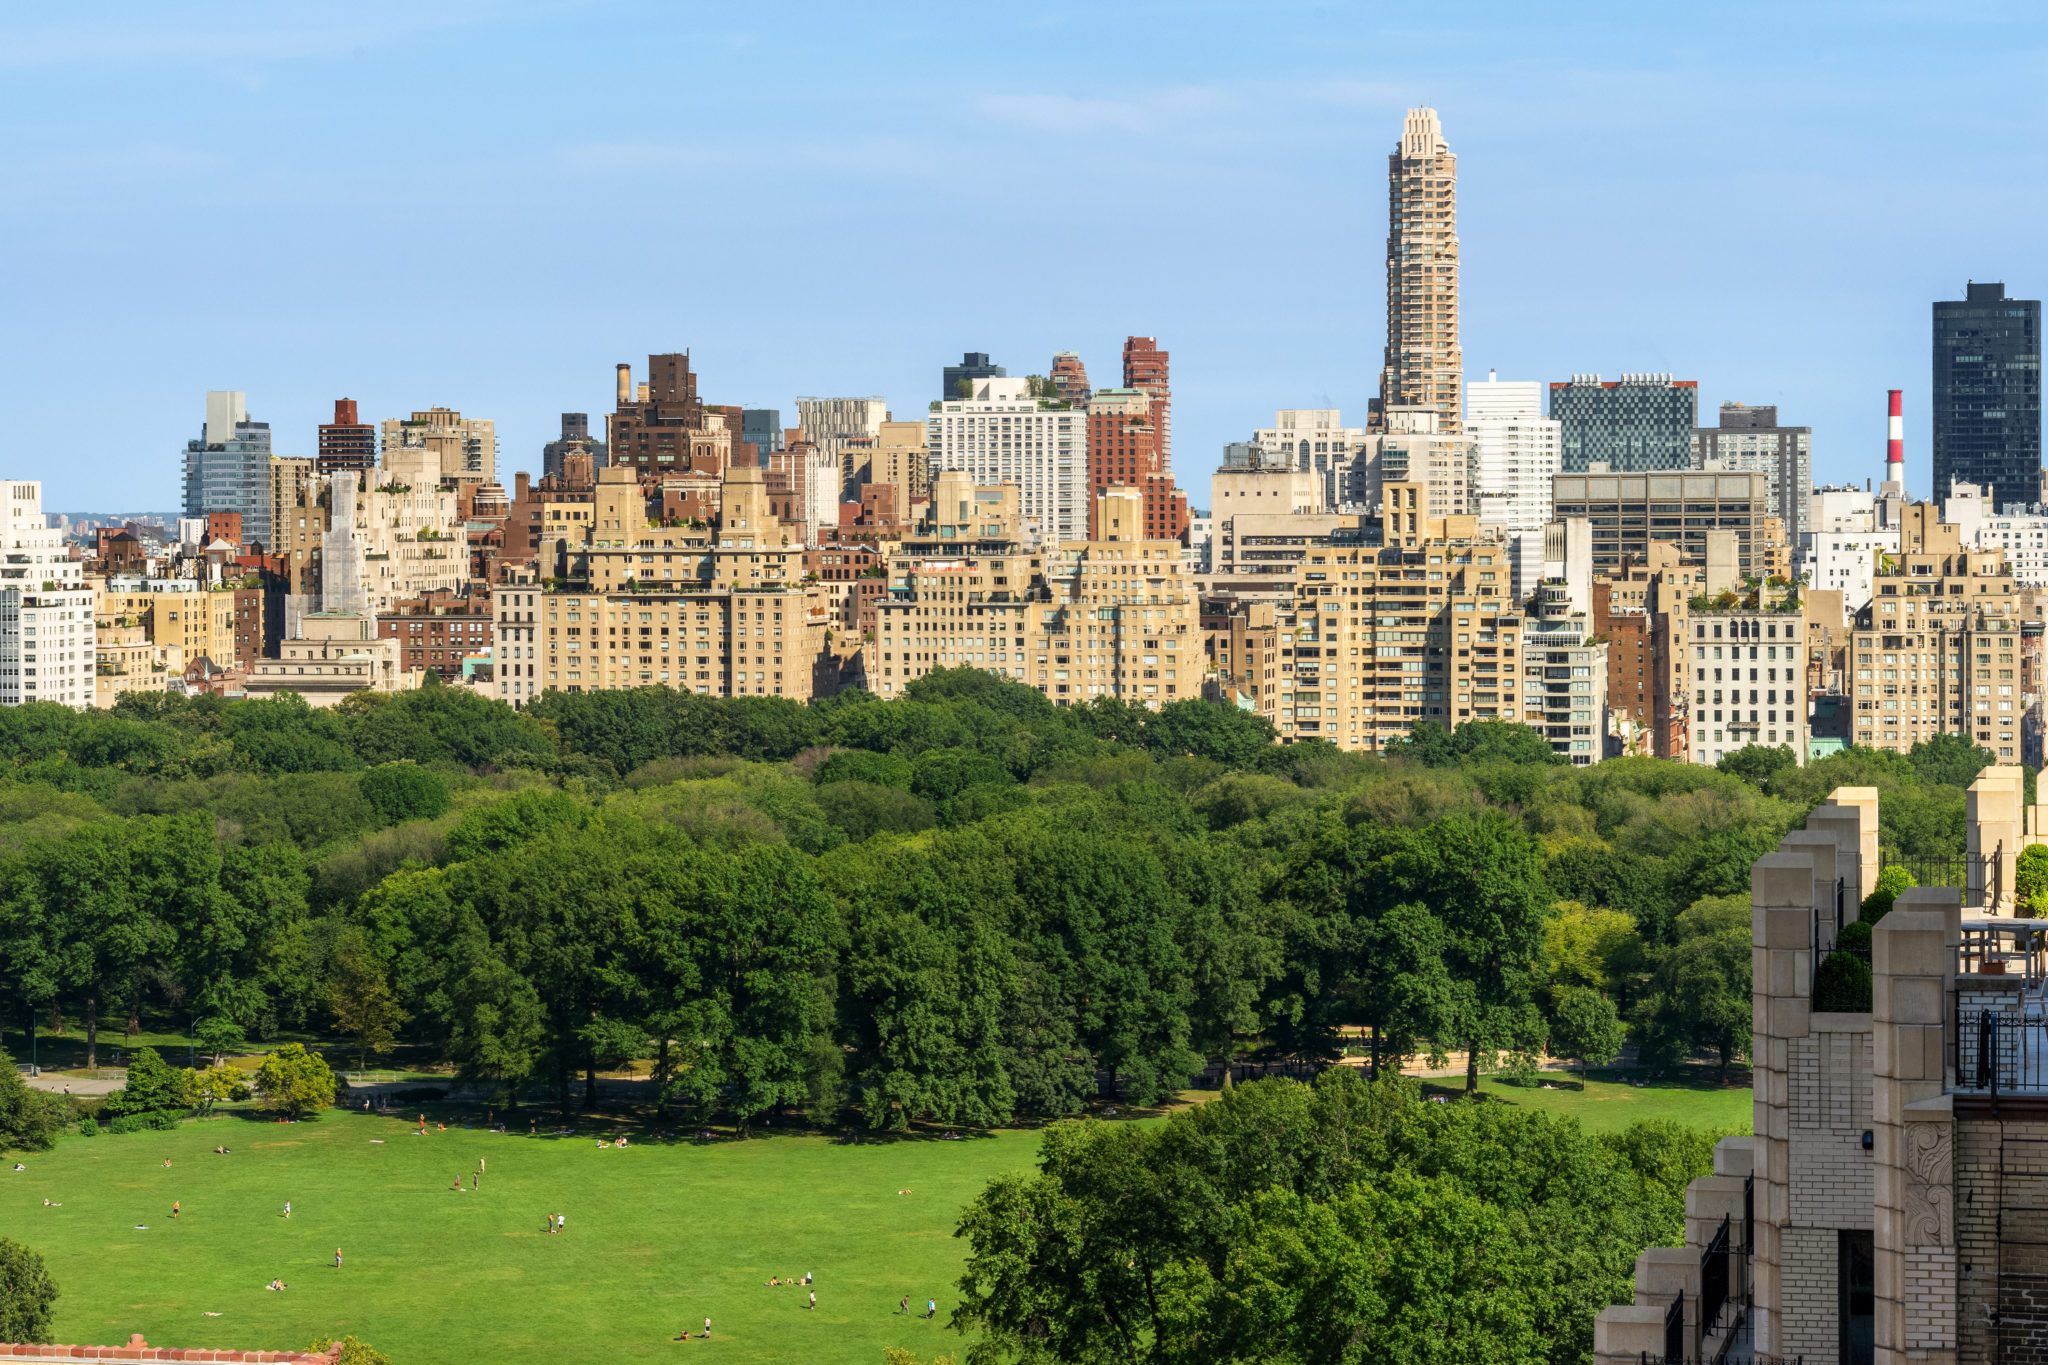
The Dakota, 1 W 72nd Street #82 83,84, Upper West Side, NY.
6,000 SF+/- | 5 Beds | 9 Full Baths $20,000,000 BespokeRealEstate.com
MANHATTAN MARKET REPORT
More than any market, the Manhattan $10 million+ recovered tremendously this year from its historic lows of last year, having sold 173 properties in the first three quarters, compared to 137 total for the whole of 2020. The third quarter stands out significantly, with a 193 percent increase in sales volume compared to Q3 2021. Though such astronomical rates indicate recovery relative to a tough year for the city, the market is also comparable to its pre- pandemic rates, with sales quantity in the first three quarters meeting 66 percent of all 2019 Manhattan sales.
The third quarter rates this year compared to the first two are also unique in Manhattan, indicating buyers’ increasing favor for the city as the year progresses. Though the other two markets had outsized second quarter sales, the third quarter was behind the second in New York City by only 12 percent, both in quantity and volume, indicating a stabilizing and recovering market throughout the year.
$2.9B total $10M+ sales volume 2021 YTD | $16.8M average sales price
173 total $10M+ sales 2021 YTD | 2020 comparison137 total sales$2.5B sales volume$18.5M average sales price
